Types of Regression Models in Machine Learning
Regression analysis is among the most widely used supervised machine learning methods. It trains labelled data to produce continuous values. When using different types of regression algorithms, it’s crucial to select the appropriate regression algorithm for the data and issue that the model attempts to answer.
Regression analysis is a predictive statistical method that assesses the relationship between the dependent variable (target variable) and different independent values (predictor variables). Numerous practical uses can be made of regression. It is crucial for any machine learning-related problem that includes numbers in a continuous manner; examples include, but are not restricted to the following:
1. Weather prediction
2. Age prediction
3. Market movements
4. Estimation of house prices
5. Estimation of stock price
6. Sales and marketing prediction
Types of Regression Models
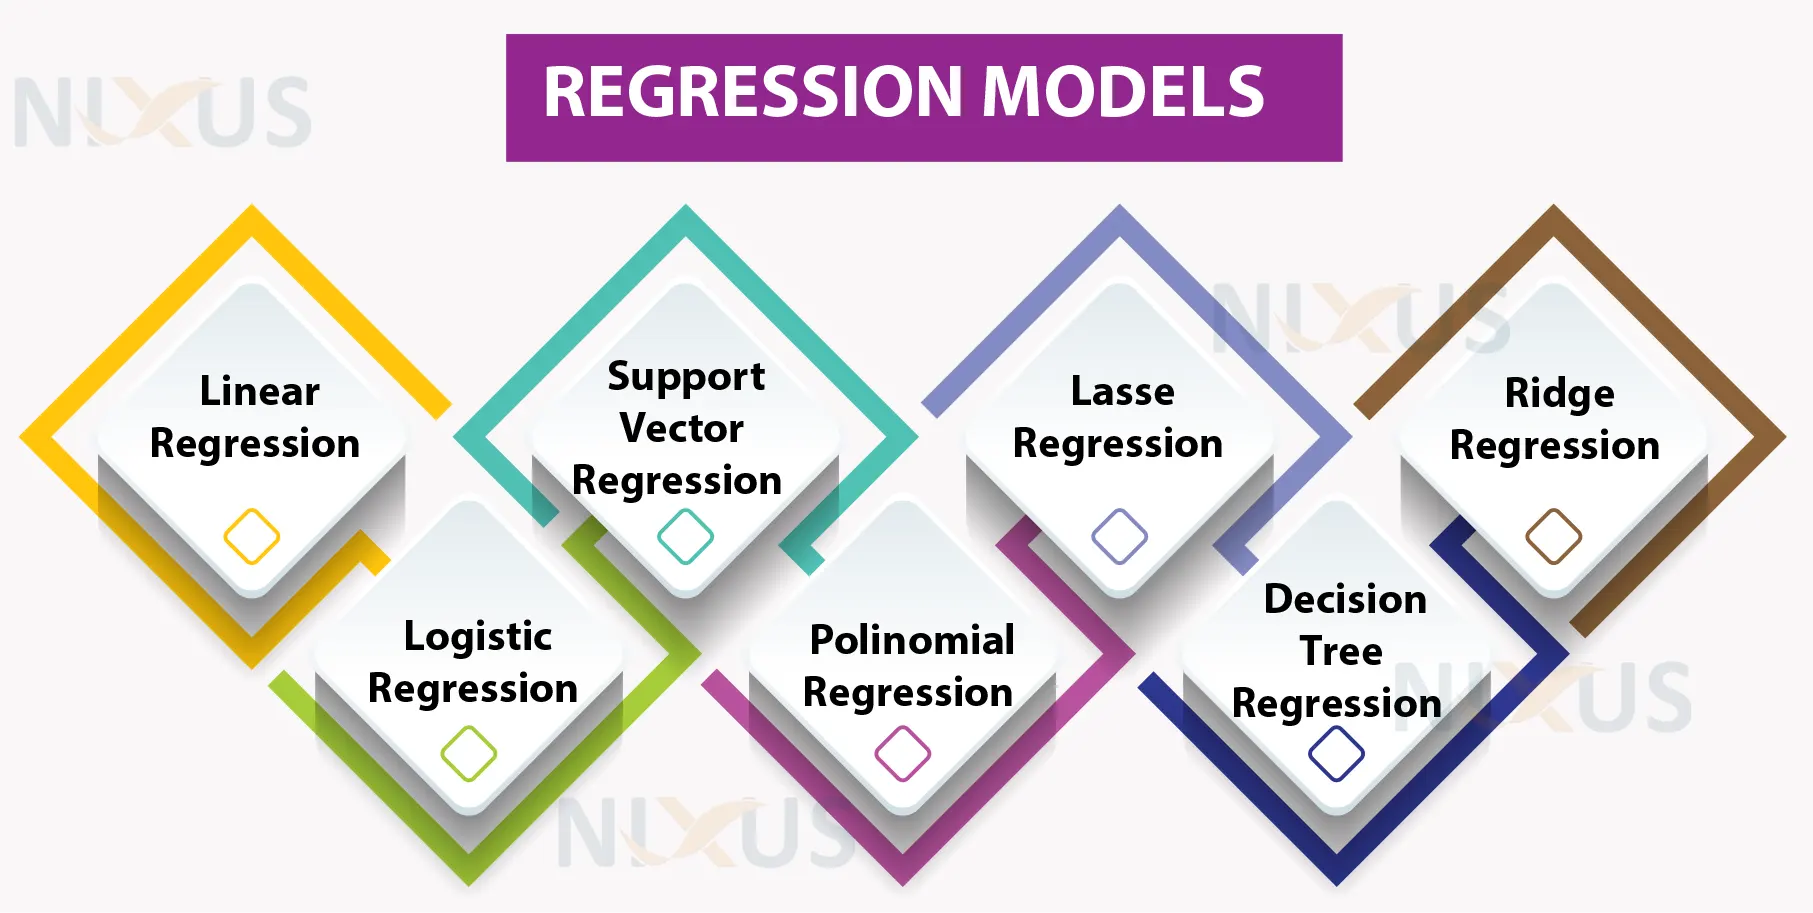
1. Linear Regression
Regression using a linear relationship between an independent and a target variable is among the most basic kinds of machine learning regression. If the variables are linearly related, one should utilize linear regression.
For example, if a business’s sales have been growing gradually every month for the last several years, it might predict future sales by performing a linear regression analysis on the sales reports with monthly sales.
Linear regression can be represented by the equation below.
Y=bX+c
Where,
Y represents target variables,
X represents predictor variables,
and b and c are the linear coefficients.
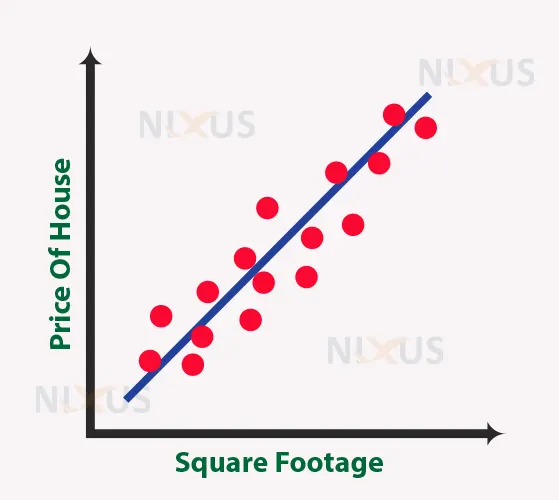
In this illustration, as the house size increases, the market value of the home increases. This could help forecast the price of houses when further data is entered in the future.
2. Support Vector Regression
Support Vector Machine is a supervised learning approach that may be applied to classification and regression issues. Therefore, it is known as Support Vector Regression if it is used for regression-related issues.
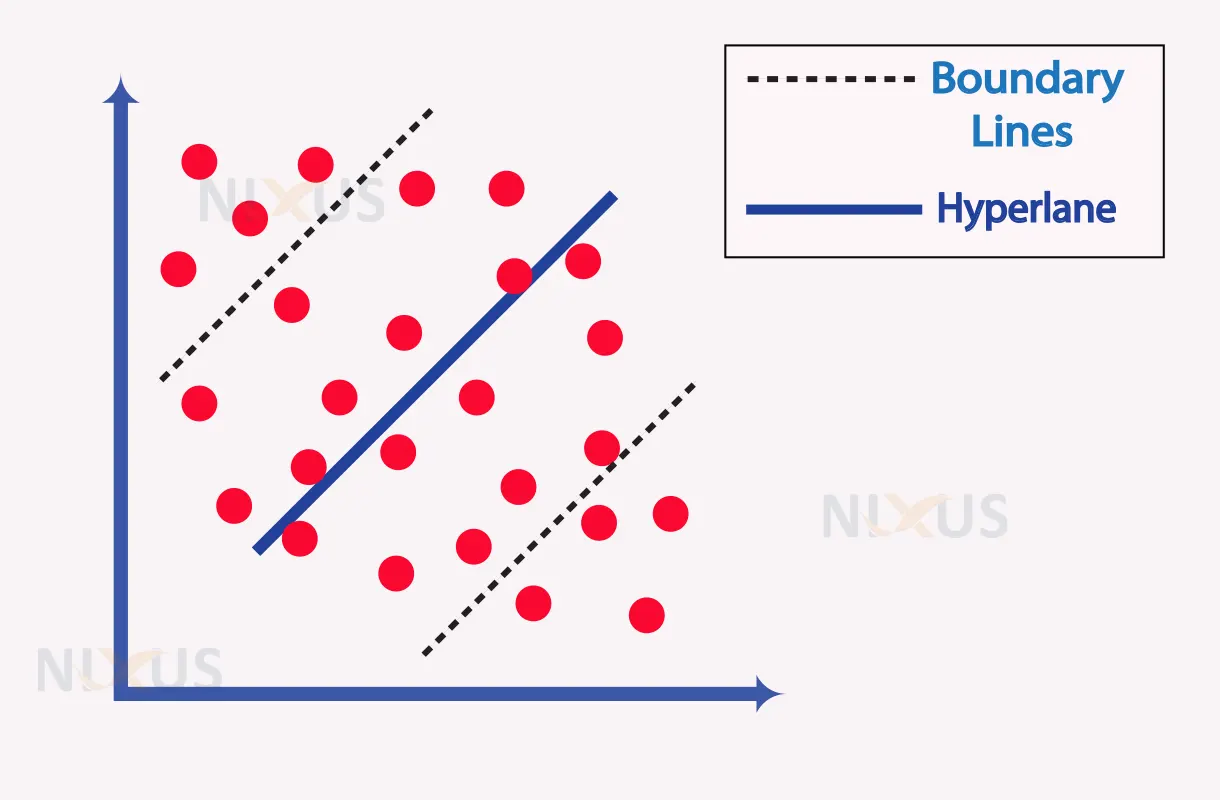
Support vector regression (SVR) aims to find a hyperplane with a maximal margin that can accommodate the greatest number of data points.
The basic objective of SVR is to consider as many data points as possible within the boundary lines, and the best-fit line must include as many data points as possible. The following is an image representation of SVR.
3. Lasso Regression
The Lasso regression algorithm is used for regularization and feature selection. It reduces the complexity of the model by forbidding the regression coefficient’s absolute value, resulting in a coefficient value approaching zero.
L1 regularization is performed using lasso regression. L1 regularization results in the addition of a penalized term to those whose value is equivalent to the absolute value of the coefficient magnitude. If there are various predictor variables that are useless, lasso regression can be quite helpful.
It can use feature selection, allowing users to pick a subset of features from the dataset and use them to create the model. Lazo regression prevents overfitting by utilizing only the necessary characteristics and leaving the remainder at zero.
Lasso regression is given by:
Min (Sum Of The Squared Residuals + 𝛂 * |Slope|)
Let’s look at an example. Suppose there’s a dataset with employee salaries in the first column and experience (in years) in the other. We need to create a model that, given experience as input, can predict an employee’s salary.
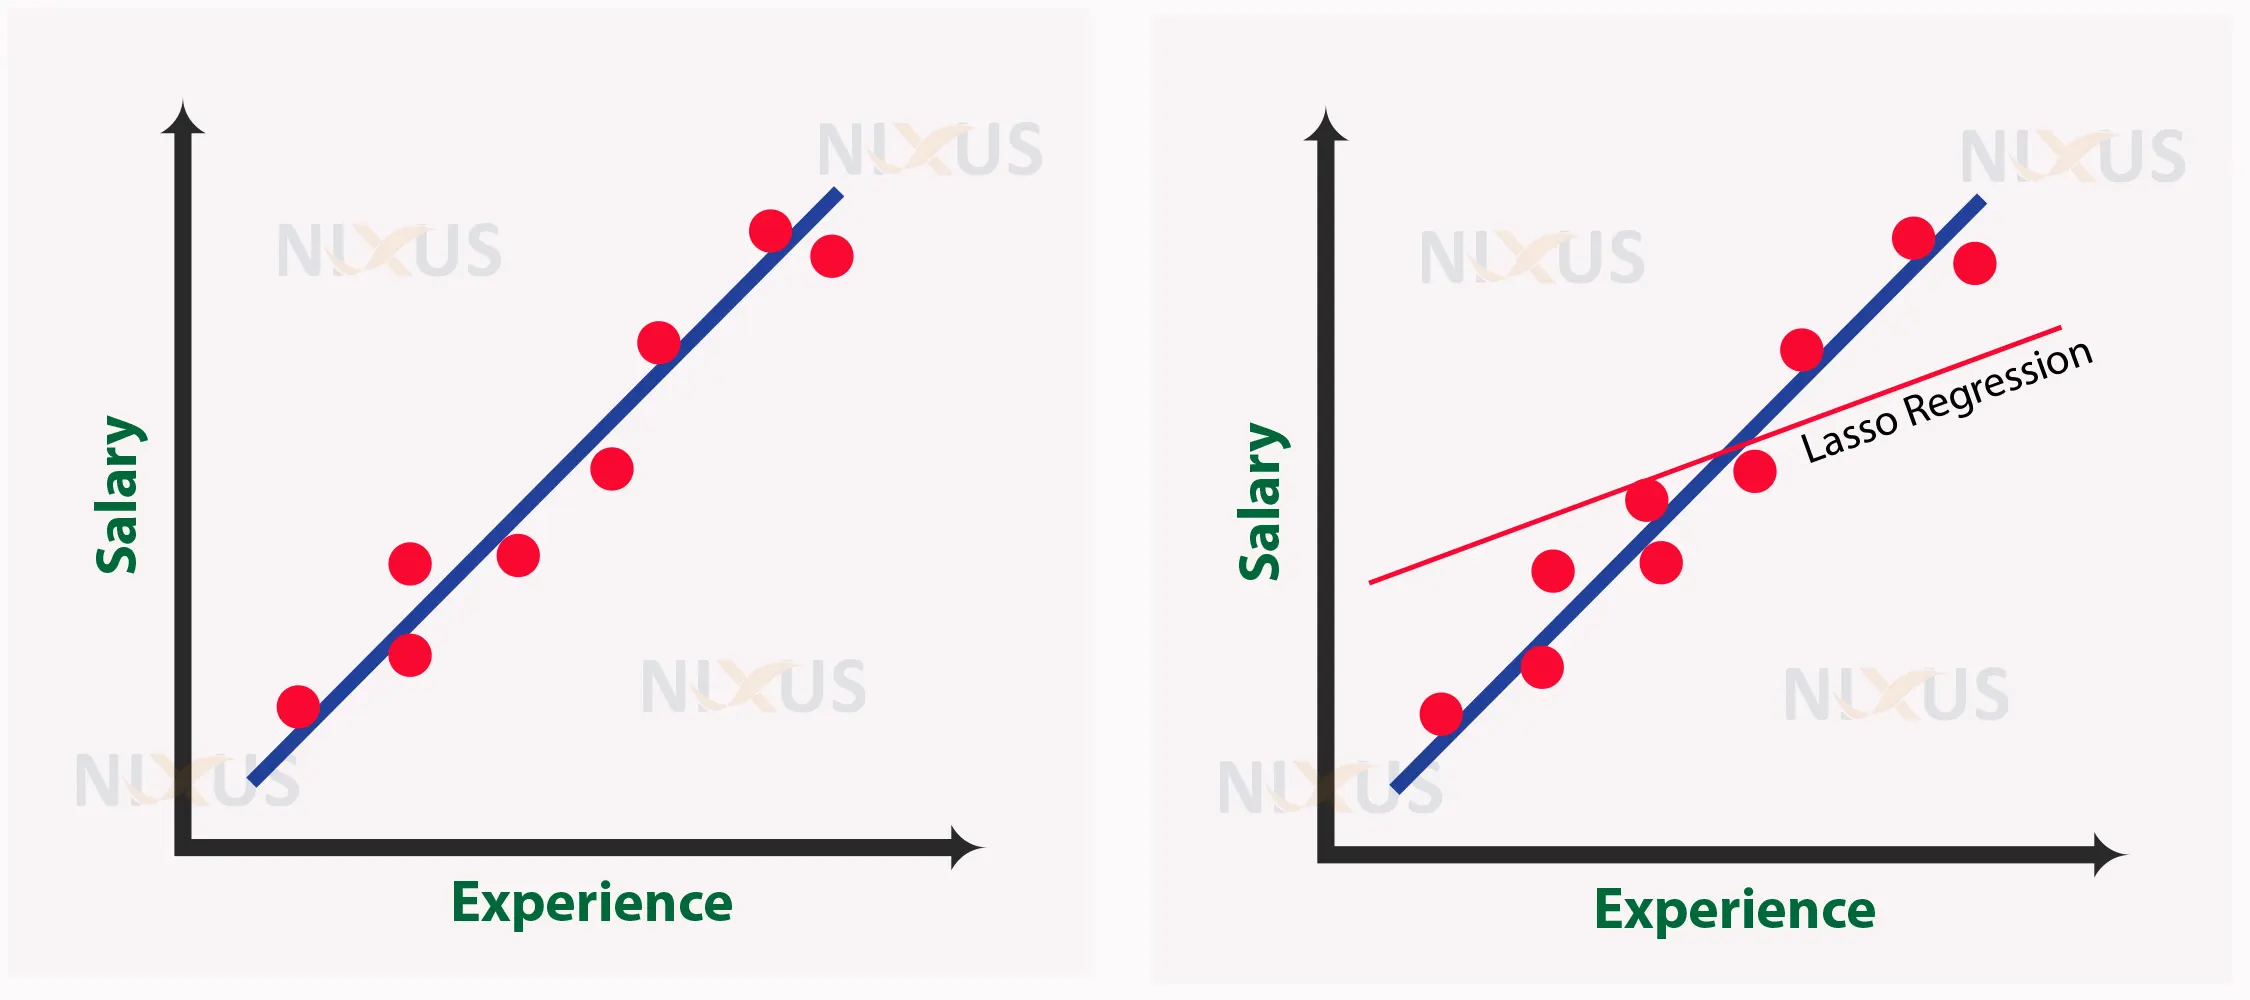
The process of lasso regression involves increasing variance, which changes the slope depending on the circumstances. With the increase in the value of alpha, the slope of the regression line decreases and turns more horizontal. With the increase of alpha, the model decreases sensitivity to the independent variable’s (Experience) variations.
4. Ridge Regression
Ridge regression, one of the most reliable types of linear regression, introduces a small degree of bias to obtain superior long-term forecasts.
Ridge regression is a specific method for analyzing multicollinear multiple regression data. Although it is a basic regularization method, it is not generally employed due to the complicated science involved in its development. If there is significant collinearity seen between independent variables, a typical linear or even polynomial regression will not succeed; in this case, Ridge regression can be employed to address the issue.
The advantage of using ridge regression is the fact that the estimations are simply approximations of the genuine population values that are sufficiently biased to be relatively accurate.
Ridge regression and lasso regression are related, and a slight difference between the two can be seen in their equations. Ridge regression is given by:
Min(Sum Of The Squared Residuals +𝞪 * Slope2 )
It can be observed that when we compare the two models while considering all of the data points, the ridge regression line more closely approximates the model than the linear regression line. Therefore, ridge regression helps optimize model fit.
5. Logistic Regression
Logistic regression is a type of supervised learning approach to addressing classification issues. Classification problems have discrete or binary dependent variables (such as 0 or 1). It is an algorithm for predictive analysis that relies on the principle of probability. Although it is a form of regression, logistic regression differs from the linear regression algorithm in terms of how it is applied.
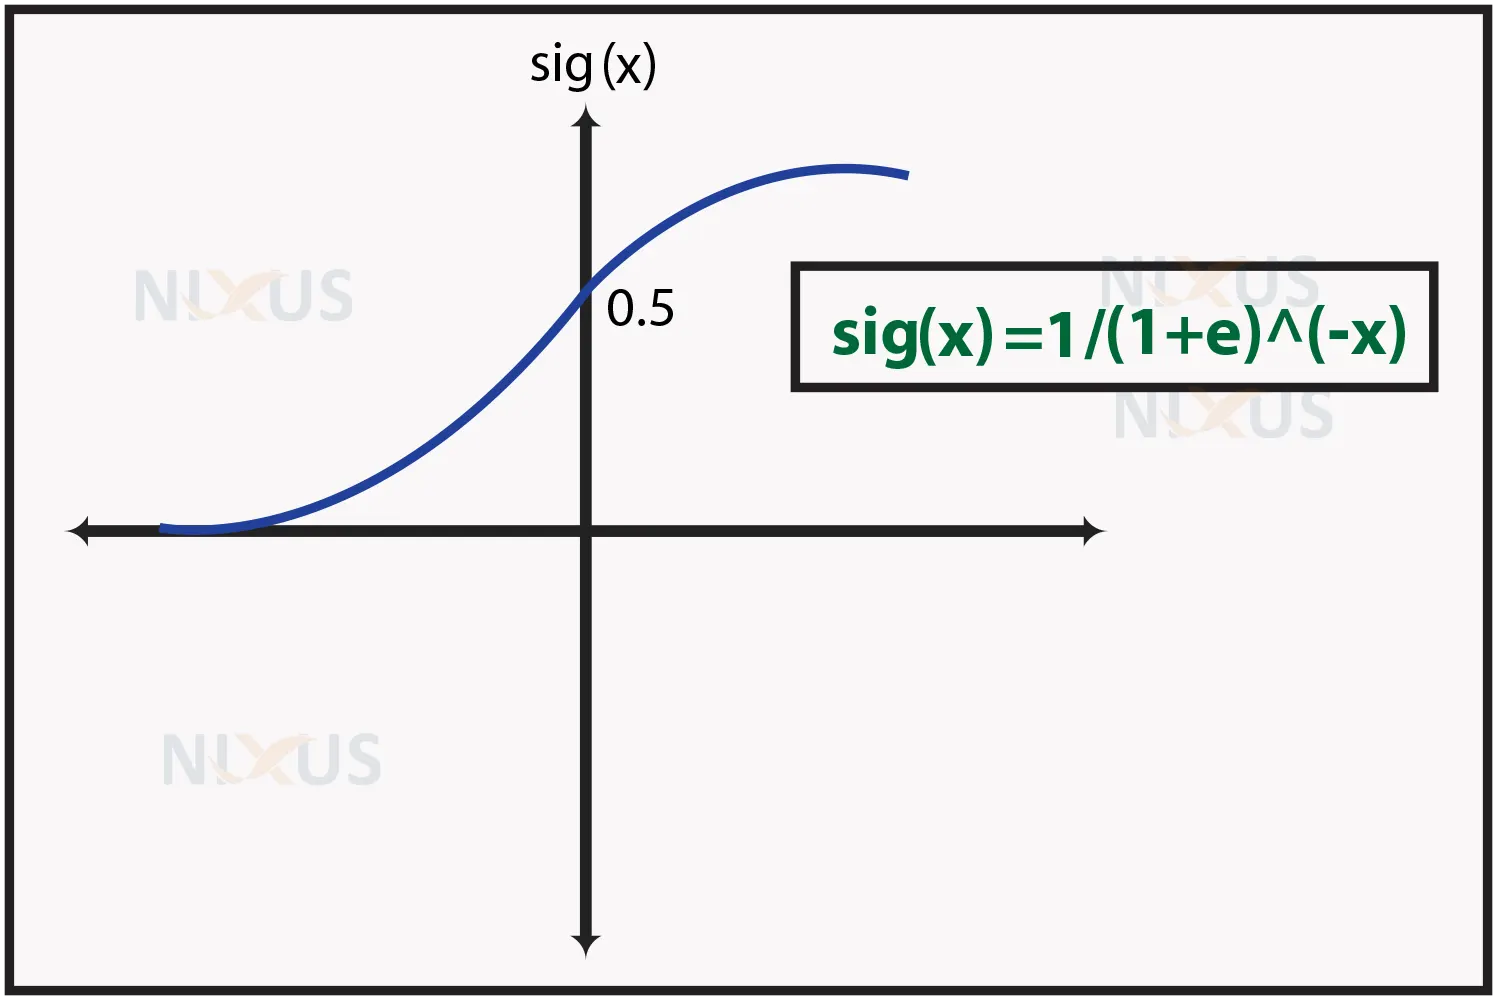
The complex cost function used in logistic regression is the sigmoid function (logistic function). In logistic regression, the data are modelled using this sigmoid function. The logistic function can be shown as follows:
f(X)=1/(1+(e)^(-x))
Where,
f(X) represents output (between the 0 and 1 value).
x represents the input to the function
e is the base of the natural logarithm.
6. Polynomial Regression
Regression techniques like polynomial regression use a linear model to represent a non-linear dataset. Polynomial regression converts the initial features into polynomial features of a specific degree before being modeled with a linear model. In other words, a polynomial line fits the data points the best.
It is to be noted that the independent variable’s power is greater than 1 in a polynomial regression. Polynomial regression is represented by the equation below:
Y = b + cX²
Where,
Y represents dependent/target variable,
X represents independent/predictor variables,
and b and c are the regression coefficients.
Polynomial regression differs from multiple linear regression in a way that in polynomial regression, a single variable has varying degrees instead of numerous elements that have the same degree.
Also, consider that overfitting can occur when a higher-degree polynomial is fitted to obtain a smaller error. Plotting the relationships will allow you to assess how well they fit and help you ensure that the curve suits the situation.
7. Decision Tree Regression
A supervised learning approach known as a decision tree can be used to solve both types of problems, namely classification and regression. It can also resolve problems involving categorical and numerical data.
The decision tree operates according to the concept of the condition, as implied by its name. It is effective and contains powerful predictive analysis algorithms. Internal nodes, terminal nodes, and branches make up the majority of their attributes. Each internal node in a decision tree regression creates a structure like a tree, with each branch denoting the outcome of the test and every leaf node denoting the ultimate decision or outcome.
Starting with the root node (dataset), a decision tree is created, which divides into subsets of the dataset (left and right child nodes). These children nodes are then subdivided into their child nodes, and eventually, these children nodes become the parent/root nodes of those nodes. Take a look at the figure below as an illustration:
Conclusion
In this article, we have studied the various machine learning regression models. It is clear that different regression models, after being employed in their specific condition, result in increased efficiency. Therefore, in order to create the model and attain the best model accuracy, one can utilize the different regression analysis types in their data science and machine learning projects.